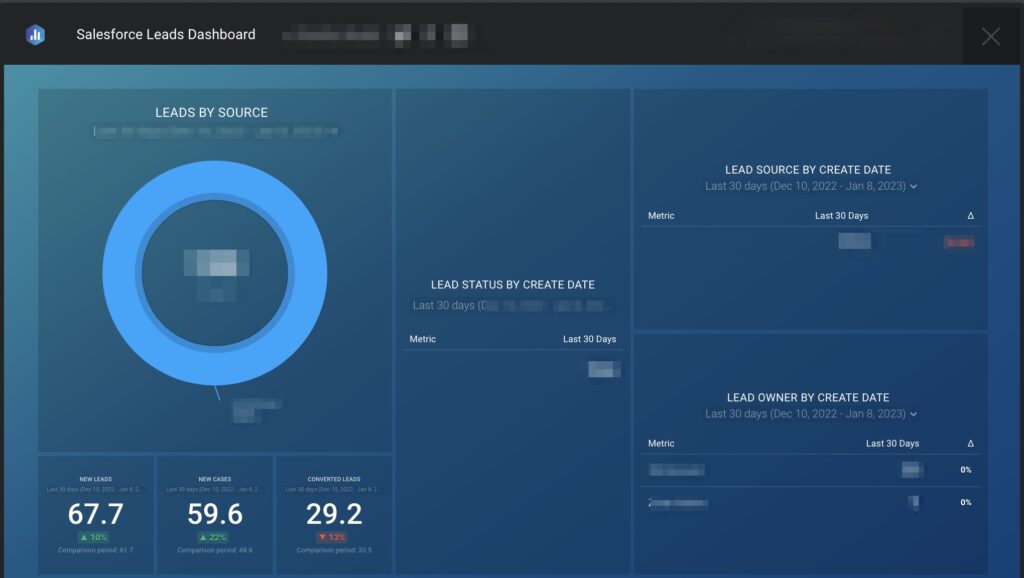
Translating complex data into visual interface
Challenge: Collect and combine real-time data from Salesforce, Pardot, LinkedIn, Google Analytics and Ads, Facebook, and Twitter in a visually cohesive dashboard for executive and board-level analysis.
Solution: Using the Databox platform and collaborating with the sales and data teams, I created a successful dashboard that the CEO presented to the board and reviewed weekly during team meetings.
PROJECT
KPI Metrics Dashboard
COMPANY
The Executive Connection (TEC)
YEAR
2020
AUTHOR
Nataliya Kozhushna